Abstract:
This
is a fun and educational lab for students in middle school and above to learn
about the Doppler shift, and about waves in general. After reviewing the basic properties of waves, with some
Socratic questioning students form their own hypothesis of what will happen to
a sound wave when emitted by a moving object. The students then construct their own instrument and test
their hypothesis in both a qualitative and quantitative manner, with the final
goal being to correctly measure the speed of an object using only the waves
emitted from it.
Background:
The
Doppler effect of sound is something that we are familiar with from our
everyday experience. When something making a loud noise (e.g., a car horn, a
fire truck siren or a train whistle) moves past us quickly, the sound changes
because the sound waves reach us differently than if everything was sitting
still. This effect happens with all types of waves, and is a very useful tool.
Let’s
think a bit more about why waves appear different if things are moving about.
Imagine you are a lifeguard in a rowboat a bit off shore guarding all the
swimmers at the beach, and that there are some waves evenly spaced apart,
moving directly towards the beach. Every few seconds, your rowboat is rocked by
a wave. What would happen if you started to row away from the beach, toward the
incoming waves? Would the waves rock your boat more or less frequently? What if
you were done working and you were rowing in toward shore? This is the essence
of the Doppler effect: that waves will be more frequent if you are moving towards
them or if the source of the waves is moving towards you, and they will seem
less frequent if the source and the observer are moving apart.
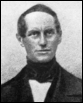 The Doppler effect was first proposed
by Christian Andreas Doppler, the man it is named after (pictured left). On May
25, 1842 at the Royal Bohemian Society in Prague he presented the paper “On the
Coloured Light of the Double Stars and Certain Other Stars of the Heavens,”
where he first predicted that motion could effect the color or frequency of
light (source info and photo http://www-history.mcs.st-andrews.ac.uk/history/Mathematicians/Doppler.html). Doppler did not get all the
details right, nor were the instruments of that era accurate enough to test his
theory with light. However, his central idea was right and that is why over 160
years later we all recognize his name. One of the first experiments to test the
Doppler effect involved having musicians play a certain note while sitting on a
moving train and having another musician record what notes he heard as they
approached and retreated.
The Doppler effect was first proposed
by Christian Andreas Doppler, the man it is named after (pictured left). On May
25, 1842 at the Royal Bohemian Society in Prague he presented the paper “On the
Coloured Light of the Double Stars and Certain Other Stars of the Heavens,”
where he first predicted that motion could effect the color or frequency of
light (source info and photo http://www-history.mcs.st-andrews.ac.uk/history/Mathematicians/Doppler.html). Doppler did not get all the
details right, nor were the instruments of that era accurate enough to test his
theory with light. However, his central idea was right and that is why over 160
years later we all recognize his name. One of the first experiments to test the
Doppler effect involved having musicians play a certain note while sitting on a
moving train and having another musician record what notes he heard as they
approached and retreated.
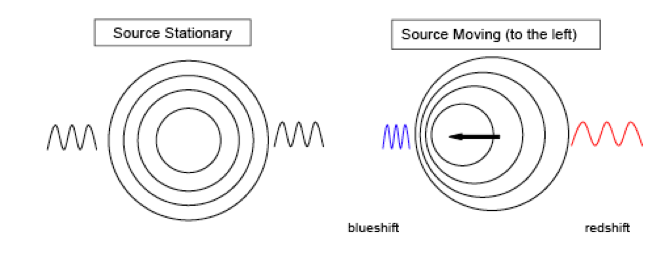
The
diagram above illustrates how our perception of light changes depending on
whether the source of the light is stationary, moving towards us, or moving
away from us. On the left side of the Figure we see that if the source is
still, an observer will just see the light with the same wavelength and
frequency as was emitted. However, on the right side of the Figure we see what
happens if the source is moving. As the source moves towards the left,
successive waves are crowded together. That is, each new wave begins a bit more to the left than if
the source stayed in one place. To an observer on the side that the source is
moving toward (the left side in our diagram), this behavior will make the
source’s wavelength appear shorter, which means its frequency will appear
higher. This change to a higher frequency/shorter wavelength is called a blueshift. However, if the observer is on the side that
the source is moving away from (the right side in our diagram), then the
opposite will happen. The successive waves will be spread out and the light
will appear to have a longer wavelength and a lower frequency. This change to a
lower frequency/longer wavelength is called a redshift.
Materials:
Procedure:
I
– Build Doppler ball
Strip
the red and black wires attached to the buzzer about a half of an inch, so that
the battery clip and the buzzer wires can be twisted together. Stripping a wire
means exposing the metal wire by removing the outer insulating cover without
damaging the wire itself.
Once
your circuit is complete and tested, secure the assembly and attach it to at
least 1.5 meters of string. Remember to test the on/off circuit before you
seal the ball up. Make sure the switch will still be accessible after sealing
the ball. Record the buzzer’s nominal frequency
in your notebook and mark it on the outside of the ball (e.g. 3,500 Hz).
II
- Empirically Observe Doppler Shift of Sound (Swing and Listen):
Once
all the Doppler balls/buzzers are assembled and working, go outside (or
somewhere with plenty of room) to experiment with them. In a clear area with
no one in the way,
double check that everything is secure and then twirl the ball around your
head. Once you are confident that the assembly will stay together turn the
buzzer on and twirl the buzzer assembly around your head, with your partners
standing several feet away. Try to swing it at a constant rate. What do you
hear? What do they hear? Describe how the sound changes. Is the pitch/frequency
constant? The volume? Try to swing it at a few different speeds. Record your
observations. Make sure the person swinging in the middle has a chance to be on
the outside and observe the sound change.
Also have two partners listening from two directions and see if they
hear the pitch change in the same way and at the same time.
III
- Getting Quantitative - the Need for Speed:
In
this portion of the lab we will try to quantify the Doppler shift. We will do
this in three steps:
1)
measure the speed of the swinging buzzer
2)
use calculations to predict what the actual Doppler shift is
3)
directly measure the Doppler shift of sound
How
would you determine the speed of the buzzer as is it swung around?
What
do we need to measure? How would you measure it?
Pull
the sting taut and use tape to mark it at multiple lengths away from the
buzzer. Pick one of the marked lengths as your handhold and record the length
(this will be your radius, r, for
below). Practice swinging the assembly at a steady constant rate with your
wrist held stiff in one position. Once the group feels that the buzzer can be
consistently swung at a steady rate, swing the buzzer at that constant rate and
time how long ten (10) complete cycles take. Record the observed times.
Now
Calculate the Speed (Speed = distance/time):
You
know the time it takes for the swinging buzzer to go around ten times, but what
was the distance traveled in that time? (Note: The circumference, c, of a circle is equal to two π times the radius, r. That is, c = 2π r). Now that you know the distance and the time, you can calculate
the observed speed for each of the 3 trials and find the average speed. Show
your calculations in your lab notebook and record the results in a data table.
Rope
Length (radius, r)
:_________________________ (meters)
Circumference
(c) = 2π r :___________________________ (meters)
Distance
for 10 rotations = 10 x 2π r =
10 x c : ___________ (meters)
Time
for 10 rotations:_______________________________(seconds)
Speed
of ball = Dist/time:____________________________(meters per second)
IV
– Equations, Calculations, & Predictions:
Mathematically,
the Doppler shift that you observed may be described by the following
equations:
Source moving towards you: f’ observed frequency
f’ = f / [1 – (v/vs)]
Source moving away from you: f’ observed frequency
f’ = f / [1 + (v/vs)]
f
= source frequency in Hertz (Hz)
f’
= perceived frequency (Hz)
v
= speed of source
vs
= speed of sound
The
speed of sound depends on the weather (both the temperature and the humidity),
but for our purposes we will assume that the speed of sound is
vs
= 350 m/s.
Calculate the expected perceived frequency of your buzzer by using the
equations above and the average speed from your earlier measurements.
What
is the calculated perceived frequency when the buzzer is
moving
towards you?_________________________________
moving
away from you?_______________________________
The
human ear can hear sounds ranging from 20 Hz to 20,000 Hz. It is most sensitive to frequencies
between 500 and 4,000 Hz and can distinguish between sounds that are a few
Hertz different.
Should
a human with normal hearing be able to detect the frequency shift you
calculated?_________________________
V
– Computer measurements
Use
sound analysis software to record the buzzer both at rest and while swinging it
at constant speed. The software
will be able to measure both the intensity and frequency of sound waves.
Can
you tell from the spectrum when the ball was moving towards the microphone and
when it was moving away?
What
is the frequency shift?
Compare
the measured Doppler shift to the calculated one. Do they agree?
Scientific applications:
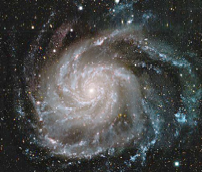 The Doppler effect is one of the core
tools of modern astronomy. Astronomers are most interested in shifts in
electromagnetic radiation waves (e.g., visible light and radio waves), and not sound waves.
Since the only thing astronomers can measure about distant objects is the waves
of light that come from them, measuring the spectrum of those waves to find the
Doppler shift is astronomers’ only speed gun. Frequency shifts just like the ones measured in this lab
were used by Edwin Hubble to find the amazing fact that all distant galaxies
are moving away from ours, leading him to claim that the Universe was
expanding!
The Doppler effect is one of the core
tools of modern astronomy. Astronomers are most interested in shifts in
electromagnetic radiation waves (e.g., visible light and radio waves), and not sound waves.
Since the only thing astronomers can measure about distant objects is the waves
of light that come from them, measuring the spectrum of those waves to find the
Doppler shift is astronomers’ only speed gun. Frequency shifts just like the ones measured in this lab
were used by Edwin Hubble to find the amazing fact that all distant galaxies
are moving away from ours, leading him to claim that the Universe was
expanding!
Beyond
astronomy and sirens, there are many important ways that the Doppler effect is
used in the world around us. Examples include: police radar, determining the
speeds of baseball pitches and tennis serves, and Doppler weather radar. All of
these examples use radio waves. For the sports events and the police, a very
well defined frequency of electromagnetic radiation is sent out (typically
x-band at 10.5 GHz). When the ball or the car is moving toward the radar gun, the
radiation from the radar gun reflects off the object and picks up a little
energy from the speeding object. The reflected radiation has a slightly higher
frequency (more energy) compared to the emitted frequency. The amount of the
blueshift is used to determine how fast the car or ball was moving.
Doppler weather radar is much more complex. It is used to look at
much larger areas: tens or hundreds of square miles rather than hundreds of
feet. It also provides us with much more information. In a manner very similar
to the Speed of Light lab that you will do, Doppler weather radar determines
how far away a storm is by how long it takes radio waves to travel to the storm
clouds, reflect, and travel back. Based on how strongly the storm reflects the
radio waves it is able to determine the composition of the storm (e.g. density, whether it is rain, hail…).
Finally, Doppler radar uses the Doppler shift to determine in what direction
and how fast a storm is moving. Visit http://www.crh.noaa.gov/radar/latest/DS.p19r0/si.klot.shtml to see the most recent Chicago Doppler radar
measurements. Also see http://www.crh.noaa.gov/fsd/soo/doppler/doppler.htm for more information from the National Weather Service
on Doppler weather radar.
Recommendations:
1)
This lab can also
be done essentially in reverse, with the frequency shift being measured, and
the speed being calculated from that frequency shift, then finding if the speed
calculated from the Doppler shift matches the speed measured with stopwatch and
meterstick.
2)
More advanced
students might be able to derive the Doppler shift equations on their own with
a little guidance and a good diagram.
3)
Any sound spectrum
analyzer should do for this lab, as the measurement will not have to be
terrifically exact. Find the one
that seems easiest for you and your students. The one we used was called Spectra Plus, which is available
for a free 30 day trial at http://www.spectraplus.com/
Conclusion:
This
lab was developed as part of a larger curriculum on the nature of light. The goal was to help students
understand waves and how the wave nature of light can explain natural
phenomena, even while observing and learning in another lab that only a light
with a particle nature could explain the photoelectric effect. We found this to be a generally
productive and enjoyable lesson on its own. It was taught to a group of students who ranged in age from
12 to 17, and the lesson seemed to work equally well for all ages. We hope that it works well for you as
well.
Special
Thanks to Randy Landsberg for help in lab development, and to Walter Glogowski,
Robert Friedman, and Sarah Hansen for help in teaching.
Please
visit our other NSTA National Conference presentations, and our website:
http://cfcp.uchicago.edu/education/index.html